Check out Chrome 4′s great new features for developers, such as cross-platform support, awesome web inspector integration, and handy new extensions. It’s becoming more and more difficult to deny Chrome the title as the new browser for web developers. If it’s
not quite there yet, it will be soon!
Introduction
With quick load times, a snappy JavaScript engine, solid WebKit foundation, and big-name backing, Google Chrome has been gaining a respectable market share, even surpassing
Safari to become the 3rd most popular browser in December. For developers, however, Firefox has been the sweetheart of many due to its ability to run on any operating system and because of its rich offering of web development add-ons, such asFirebug and
the Web Developer Toolbar. But it’s important
to test JavaScript in all browsers, and having a robust set of tools in each (including Internet Explorer), is precisely what developers need to make the most of their code.
Lucky for us, the Google folks have been working hard to make Chrome cross-platform, integrate WebKit’s fantastic Web Inspector, and add extensions, making Chrome 4 an amazingly useful tool for web development. In this tutorial, I’ll demonstrate some of the
features that make Chrome 4 a great addition to the web developer utility belt.
Downloading Chrome 4
As of January 25, Chrome 4 has been officially released as stable for Windows. Mac and Linux users, however, we have to be a bit more brave in order to experience all that Chrome 4 has to offer. Mac users need to download the “dev” version, and Linux users
the “beta” version, and it’s highly worth it! Check out the following links to get a copy of Chrome for your operating system that supports everything we’ll discuss in this article:
Web Inspector (aka Developer Tools)
Now let’s get into the nitty gritty! In Firefox, Firebug is a godsend for developers, providing a debugging console, HTML & CSS manipulation, JavaScript profiling, and a
whole lot of other goodness. The WebKit folks took notice and over the last couple of years have been perfecting a set of tools called the Web Inspector, which offers a similar set of features to Firebug. Within Chrome 4, the Web Inspector is labeled “Developer
Tools.”
Accessing the Web Inspector/Developer Tools
In addition to Chrome 4, the Web Inspector has been in action for a while from within previous versions of Chrome and Safari, although it’s a bit hidden. To access the Web Inspector in various browsers:
Safari 4
- Select “Edit > Preferences” (Windows) or “Safari > Preferences” (Mac)
- Select the “Advanced” tab
- Check “Show Develop Menu in menu bar”
- A new menu item, “Develop,” will appear
- Select “Develop > Show Web Inspector”
Chrome 3 (Windows only)
- Select the Wrench
- Select Developer
- Select JavaScript Console (the whole range of tools are hidden under this name)
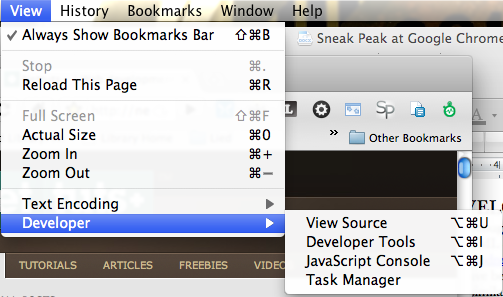
Chrome 4
- Windows / Linux: Select the Page Icon > Developer > Developer Tools
- Mac: Select View > Developer > Developer Tools
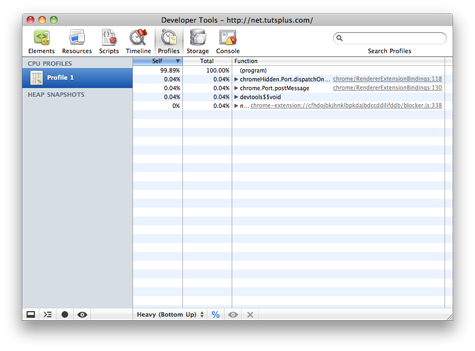
JavaScript Console
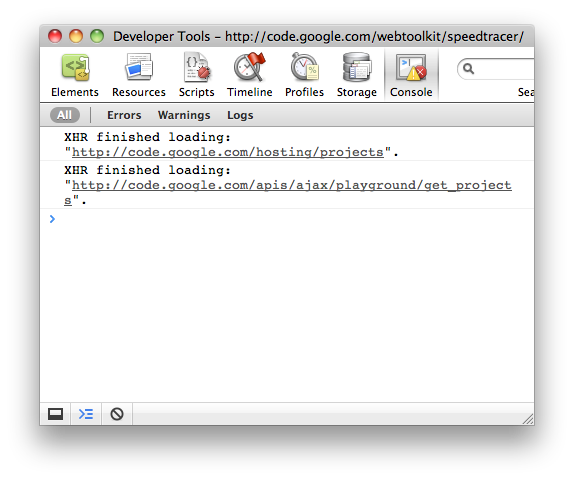
If you haven’t worked with the Firebug or Web Inspector console, then you’re missing out on a great way to help debug JavaScript. The JavaScript console serves several important functions, such as capturing errors and presenting them in a useful format, testing
short bits of JavaScript, and as a convenient place to log useful information like variable values and execution times. Practically speaking, I use this tool regularly to evaluate the performance of my programs and to ensure that certain variables are being
calculated correctly.
Elements Panel

In addition to the JavaScript console, it’s always nice to have a tool that allows you to quickly view the HTML and style information of particular elements on the page. The Web Inspector Elements panel gives a tree-structure view of the Document Object Model
(DOM), allowing you to drill down into the document to select an item of interest. You can also access the information of a certain object by right clicking on an item within the browser and selecting “Inspect Element.”
Finally, I should note that the Elements panel allows for much more than simple inspection. You can modify and add styles, edit html, and in the latest versions, view event listeners attached to a selected DOM element. These features can all come in very handy
when you’re dealing with little quirks that you can’t quite figure out.
Resources
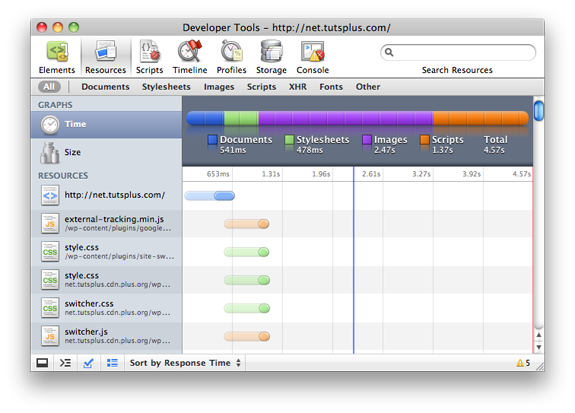
The last feature I’d like to highlight within the Web Inspector/Developer Tools is the “Resources” tab. If you’ve worked with Firebug’s “Net” tab, then you’ll notice several similarities. Essentially, the Resources tab gives a breakdown of all the information
that is exchanged between your browser and the server, from the images to the JavaScript to the document itself. It also shows a ton of handy information, such as:
- A graph of the time it takes to download each component
- A graph showing the size of the various components
- A way to sort the requests by type, e.g. Documents, Stylesheets, Images, etc.
- Image previews with dimensions, file size, and MIME type displayed below
- Request and Response Headers
- XML HTTP Request (XHR) information
An elegant tool that allows for easy inspection of page speed, the Resources tab can aid you in identifying and squashing performance bottlenecks. Give it a try and see where your page is too fat, then slim down your chunky images and code to provide a better
experience for your users!
Further Reading
A complete overview of the Web Inspector/Developer Tools could easily be a tutorial on it’s own, but we have more ground to cover! I highly recommend checking out the following resources to learn more:
-
Video demos of the Developer Tools from the Google folks themselves
hosted at the Chromium Projects Wiki! -
A step by step walk through of
the Developer Tools, also available from the Chromium Wiki -
A rundown of the latest Web Inspector Features from
the Surfin Safari blog (thanks goes out to Timothy Hatcher, one of the Web Inspector developers, for the link!)
Extensions
Now, while I’ve always been blown away by the speed of Safari 4 and Chrome as compared to Firefox, they’ve both lacked a critical feature: add-ons. In Chrome 4, that all changes with the addition of “extensions.” You can add functionality to Chrome by downloading
and installing extensions or by using the standard tools of the trade: HTML, CSS, and JavaScript, to write your own. Extensions can be downloaded from the Chrome
Extensions Repository, and should be fairly simple to install. Already, a number of very compelling extensions have been created which aid web development, from quick validation to resolution testing. Let’s take a look at a few.
Speed Tracer

A web developer can never really be obsessed enough with performance, and the more tools that identify sluggish performance the better. That’s just where Speed Tracer, a Chrome extension developed by Google, comes into play. Speed Tracer takes the “Resources”
panel to the next level by providing a visualization of the time it takes to execute low-level tasks, such as rendering CSS or parsing HTML and JavaScript. I’d highly recommend taking a look at a video
demonstration of Speed Tracer put together by the folks at Google to get a better idea of how it can help you improve the performance of your applications.
Pendule

Moving from Firefox to Chrome, one extension everyone is going to look for is a replacement of the fantastic Web Developer Toolbar. For those who don’t know, the Web Developer Toolbar deals with the tasks Firebug wasn’t meant to handle, such as quick validation
of HTML and CSS, the ability to quickly disable JavaScript or images, and a tool for checking links. Those functions are all handled with style by Pendule, which offers much of the core functionality of the Web Developer Toolbar (not quite all), while offering
a few goodies of it’s own, such as a color picker.
Resolution Test

Web Developers often need to ensure that their designs work at a variety of resolutions. Resolution Test allows developers to efficiently resize their browser window to a number of common resolutions for quick and easy testing. The latest version even allows
you to open multiple windows at different resolutions with only a couple of clicks. Resolution Test is fantastic for making sure your target audience is seeing the page you want them to see.
Webpage ScreenShot

There are occasions when its necessary not only to grab a screenshot of the current visible portion of a website, but a screenshot of the whole page. For example, you may want to print a full page for peer critical review or to demonstrate in your portfolio.
I formerly used a Desktop tool for this, but now Webpage ScreenShot does a nice job of capturing full-page screenshots in a few clicks.
Chrome Sniffer

Do you ever stumble upon a fantastic page and wonder, “what are they using to build this?” I do, and often find myself digging through the source code trying to figure out who the man behind the curtain is. While it is a useful training exercise, and a necessary
one if you really want to know what’s going on, Chrome Sniffer can usually give you a snapshot of which JavaScript and PHP frameworks are in
use for a particular page. For example, navigate to NetTuts and Chrome Sniffer informs us that it’s run on WordPress using Google Analytics and jQuery.
Conclusion
The future of web development continues to look brighter and brighter! While only a few years ago we had a limited set of tools for debugging JavaScript, tinkering with CSS, and viewing HTML, today we have a variety of powerful options. Now that Google Chrome
has become cross platform, fully integrated the WebKit Web Inspector, and added extensions, it is a versatile tool for helping developers improve their own pages. I encourage all of you to download a copy for yourself and give it a shot to see if it can help
you improve your pages, then come on back here and share your favorite plugins and tools with the rest of us!