S型增长实例
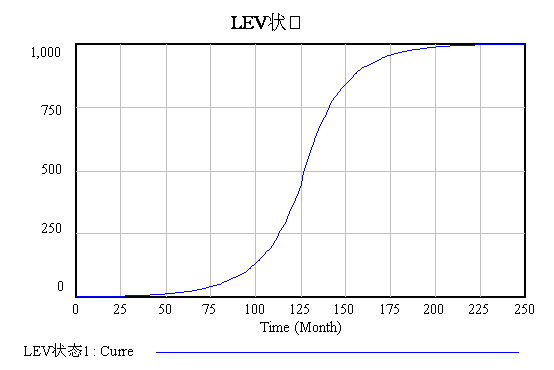
该实例具体演示了S型增长曲线,该曲线前半部分为指数增长,后半部分为负反馈起作用。
具体方程如下:
(1) FINAL TIME = 250
Units: Month
The final time for the simulation.
(2) INITIAL TIME = 0
Units: Month
The initial time for the simulation.
(3) LEV状态1= INTEG (
RT速率2,
1)
Units: **undefined**
(4) myRTV(
[(0,-10)-(1200,100)],(0,0),(100,5),(200,10),(300,15),(400,20),(500,25),(600
,20),(700,15),(800,10),(900,5),(1000,0),(1100,-5),(1200,-10))
Units: **undefined**
(5) RTV3=
myRTV(LEV状态1)
Units: **undefined**
(6) RT速率2=
RTV3
Units: **undefined**
(7) SAVEPER =
TIME STEP
Units: Month [0,?]
The frequency with which output is stored.
(8) TIME STEP = 1
Units: Month [0,?]
The time step for the simulation.
可以看出,LEV状态呈现的是S型曲线。最后稳定在一定的值。
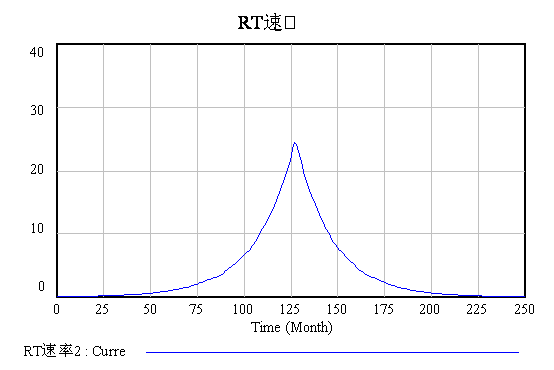
从图可以看出,RT速率开始时是正增长,后来转变为负增长。


