27个Javascript图表/图形制作组件。有些是基于jQuery开发,有些是基于MooTools框架开发。希望大家能用得上。
jQuery
Visualize

jQuery Visualize is JavaScript library that allow us to generate bar, line, area, and pie chart visualizations data from an HTML table using the HTML5 canvas element.
This technique provides a simple way to generate charts, but more importantly, because it bases the chart on data already in the page in an HTML table element, it is accessible to people who browse the web with a screen reader or other assistive technology,
or with browsers that don’t fully support JavaScript or HTML5 Canvas.
Google Chart Tools

The Google Chart Tools enable adding live charts to any web page. It has A rich gallery of visualizations provided as
- Image charts – using a simple URL request to a Google chart server
- Interactive charts – using a Google developed JavaScript library
Google Chart can read live data from a variety of data sources, simple to use and free.
flot

Flot is a pure Javascript plotting library for jQuery. It produces graphical plots of arbitrary datasets on-the-fly client-side. The focus is on simple usage
(all settings are optional), attractive looks and interactive features
like zooming and mouse tracking. The plugin works with Internet Explorer 6/7/8, Firefox 2.x+, Safari 3.0+, Opera 9.5+ and Konqueror 4.x+ with the HTML canvas tag (the excanvas Javascript emulation helper is used for IE).
Highcharts

Highcharts is a charting library written in pure JavaScript, offering an easy way of adding interactive charts to your web site or web application. Highcharts currently supports line, spline, area, areaspline, column, bar, pie and scatter chart
types. It works in all modern browsers including the iPhone/iPad and Internet Explorer from version 6. Standard browsers use SVG for the graphics rendering. In Internet Explorer graphics are drawn using VML.
Raphaël
Raphaël is a small JavaScript library that should simplify your work with vector graphics on the web. If you want to create your own specific chart or image crop and
rotate widget, for example, you can achieve it simply and easily with this library. Raphaël ['ræfe??l] uses the SVG W3C
Recommendation and VML as a base for creating graphics. Raphaël currently supports Firefox 3.0+,
Safari 3.0+, Chrome 5.0+, Opera 9.5+ and Internet Explorer 6.0+.
gRaphaël

gRaphaël’s goal is to help you create stunning charts on your website. It is based on Raphaël graphics
library. gRaphaël currently supports Firefox 3.0+, Safari 3.0+, Opera 9.5+ and Internet Explorer 6.0+.
RGraph

RGraph is a HTML5 canvas graph library. It uses features that became available in HTML5 (specifically, the CANVAS tag) to produce a wide variety of graph types: bar
chart, bi-polar chart (also known as an age frequency chart), donut chart, funnel chart, gantt chart, horizontal bar chart, LED display, line graph, meter, odometer, pie chart, progress bar, rose chart, scatter graph and traditional radar chart.
jqPlot

jqPlot is a plotting and charting plugin for the jQuery Javascript framework. jqPlot produces beautiful line, bar and pie charts with many features:
- Numerous chart style options.
- Date axes with customizable formatting.
- Up to 9 Y axes.
- Rotated axis text.
- Automatic trend line computation.
- Tooltips and data point highlighting.
- Sensible defaults for ease of use.
Bluff

Bluff is a JavaScript port of the Gruff graphing library for Ruby. It is designed to support all the features of Gruff with minimal dependencies; the only third-party
scripts you need to run it are a copy of JS.Class (2.6kB gzipped) and a copy of Google’s ExCanvas to support canvas in Internet Explorer. Both these scripts are supplied
with the Bluff download. Bluff itself is around 11kB gzipped.
Flotr

Flotr is a javascript plotting library based on the Prototype Javascript Framework and inspired by Flot (written
by Ole Laursen). Flotr enables you to draw appealing graphs in most modern browsers with an easy to learn syntax. It comes with great features like legend support, negative value support, mouse tracking, selection support, zoom support, event hooks, CSS styling
support and much more.
JS Charts

JS Charts is a JavaScript chart generator that requires little or no coding. JS Charts allows you to easily create charts in different templates like bar
charts, pie charts or simple line graphs. Moreover, JS Charts is free for
non-commercial use. For commercial use, get the full license for only $149.
jQuery Sparklines
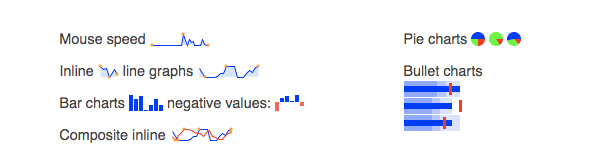
This jQuery plugin generates sparklines (small inline charts) directly in the browser using data supplied either inline in the HTML, or via javascript. The plugin is
compatible with most modern browsers and has been tested with Firefox 2+, Safari 3+, Opera 9, Google Chrome and Internet Explorer 6, 7 & 8. The plugin was written by Gareth Watts for Splunk Inc and released under the New BSD License.
TufteGraph

TufteGraph is a JS library by which you can easily create graphs. All the configuration is by dynamic functions, allowing for a really compact API. Also, Non-core layout is done via CSS rather than code. You can customize the style of graph by editing
it’s CSS.
MilkChart
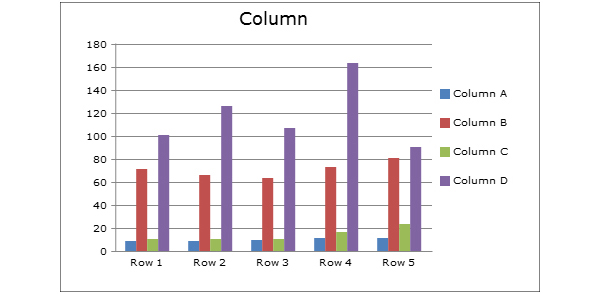
MilkChart is a simple to use, Graphing library for MooTools. This library will generate a graph similar to Microsoft Excel. To transform a table of data into a chart,
simply create a MilkChart object of the chart type you wish passing in the table id and an object containing options for the chart.MilkChart allows you to easily create charts in different templates like Column
Chart, Bar Chart, Line Chart, Scatter
Chart, or Pie Chart.
PlotKit

PlotKit is a Chart and Graph Plotting Library for Javascript. It has support for HTML Canvas and also SVG via Adobe SVG Viewer and native browser support. PlotKit is
fully documented and there is a quick tutorial to get you started. PlotKit is a complete rewrite of CanvasGraph. It is better structured and supported.
Scruffy
Scruffy is a Ruby library for generating attractive and powerful graphs,
useful for web applications, print media and many others. It’s highly customizable and powerful. You can change the backgrounds, mix different types of graph together, change the graphics used for the points, change the line types, etc. You can also render
to different types of output.
Smoothie Charts

Smoothie Charts is a really small charting library designed for live streaming data such
as real time streaming data pushed over a WebSocket. It only works on Chrome and Safari. It doesn’t support legends Or pie-charts. In fact, it’s inferior in virtually every way to a library like Flot. But, it’s very good at displaying streaming data.
Gruff Graph

Gruff Graph is a project to make beautiful graphs with Ruby. It Can be used alone or with Ruby on Rails. This library allow us to graph negative numbers (line and bar),
specify colors, and customize the graphs in other ways.
mooBarGraph

mooBarGraph is AJAX graph plugin for MooTools which support two types of graphs, simple bar and stacked bar graph. This plugin made graph from your JSON data and is
compatible with all major browsers including IE6.
jqBarGraph

jqBarGraph is jQuery plugin that gives you freedom to easily display your data as graphs. There are three types of graphs: simple, multi and stacked. All you have to
do is to pass your data to this plugin. This plugin is compatible and fully tested with Safari 2+, Internet Explorer 6+, Firefox 2+, Google Chrome 3+, Opera 9+.
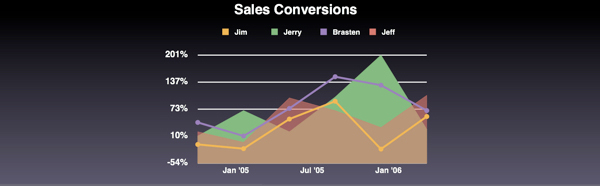
Grafico

Grafico is a javascript charting library built with Raphaël and Prototype.js.
The library provides a wide array of graphs and stays with the guidelines laid out by Stephen Few and Edward Tufte. Grafico provides pretty charts that effectively communicate their information. Minified, Grafico is about 30kb and available under the MIT license.
moochart
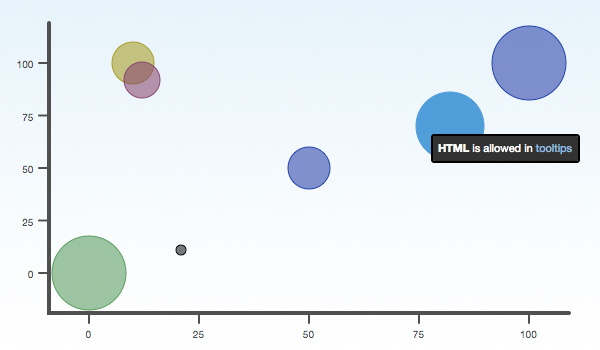
moochart is a plugin for MooTools 1.2 to create goog looking and customable bubble diagrams
on the canvas tag. The moochart can be customized using a bunch of options or argument such as, width, height, bubbleSize, line color , bubble color, tooltips
and more.
Dygraphs

Dygraphs is an open source JavaScript library that produces produces interactive, zoomable charts
of time series. It is designed to display dense data sets and enable users to explore and interpret them. You can mouse over to highlight individual values.
Click and drag to zoom. Double-click to zoom back out.
Canvas 3D Graph

Canvas 3D Graph is a special type of bar graph that plot numbers in 3D. This first started as PHP-GD project, but soon the creator realized that there is not much sense in generating complex graph like this on server side (script worked really fast,
though)
Protovis

Protovis composes custom views of data with simple marks such as bars and dots. Unlike low-level graphics libraries that quickly become tedious for visualization, Protovis
defines marks through dynamic properties that encode data, allowing inheritance, scales and layouts to simplify construction. Protovis is free and open-source, provided under the BSD License. It uses JavaScript and SVG for web-native visualizations.
ProtoChart

ProtoChart is an opensource library using Prototype and Canvas to create good looking charts. This library is highly motivated by Flot, Flotr and PlotKit libraries.
MooWheel

The purpose of this script is to provide a unique and elegant way to visualize data using Javascript and the <canvas> object. This type of visualization can be used to display connections between many different objects, be them people, places, things,
or otherwise. The script is licensed under an MIT-style license.
Processing.js

Processing.js is the sister project of the popular Processing visual programming language, designed for the web. Processing.js makes your data visualizations, digital art, interactive animations, educational graphs, video games, etc. work using
web standards and without any plug-ins. You write code using the Processing language, include it in your web page, and Processing.js does the rest. It’s not magic, but almost.