IntroductionMac OS X's CrashReporter is a useful facility for learning about problems your application is experiencing in the field. CrashReporter performs two useful actions:
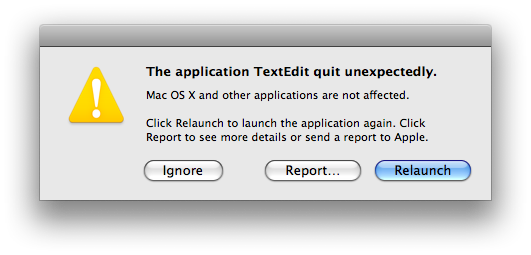
Figure 1: First CrashReporter dialog
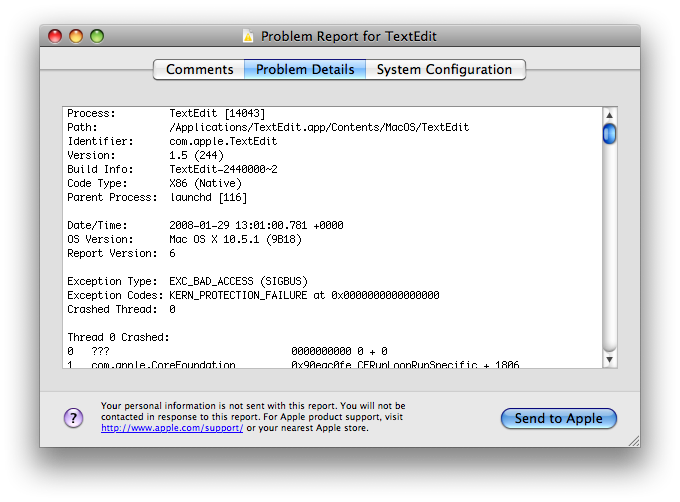
Figure 2: Second CrashReporter dialog
In this technote I explain how to interpret crash logs that you have obtained from end users. In the first section I explain each part of the crash log in
IMPORTANT: This technote describes CrashReporter as it's implemented in Mac OS X 10.5. CrashReporter has evolved over time, and there are numerous differences between the current version and earlier ones. I've called out these Note: CrashReporter has limited support for some deprecated technologies, most notably the PEF binary image format. This technote does not describe that support. Crash Log Placement
CrashReporter usually places the crash log in the user's home directory, as explained above. However, under some circumstances it will put the crash log in
Each crash log is written to a separate file. The file name is of the form
IMPORTANT: CrashReporter also creates other files within the CrashReporter directory. Specifically, it creates files of the form
Note: Prior to Mac OS X 10.5 CrashReporter created files of the form CrashReporter Logging
CrashReporter logs via Apple System Log. All CrashReporter log entries have the Facility set to "Crash Reporter". You can display all such message with the command shown in Listing Listing 1: Displaying all CrashReporter log entries $ syslog -k Facility eq "Crash Reporter" […] […] Formulating crash report for process TextEdit[9803] […] Saved crashreport to /Users/quinn/Library/Logs/CrashReporter/\ TextEdit_2008-01-29-204411_guy-smiley.crash using uid: 2000 gid: 2000, \ euid: 2000 egid: 2000
You can display recent log entries and wait for more to show up (much like Listing 2: Waiting for new CrashReporter log entries $ syslog -w -k Facility eq "Crash Reporter" […] You can do the same thing from the Console application by choosing New Log Database Query from the File menu and then configuring the query to search for log messages where the Facility is "Crash Reporter".
Note: Prior to Mac OS X 10.5 CrashReporter logged to both the system log ( Crash Log Versions
Crash logs include a version number that you can use to interpret the information contained in the log. This version number is loosely Table 1: Crash Log Versions
Anatomy of a Crash LogA crash log has a number of different parts; in the following sections I describe each part in detail. Process InformationThe first part of the crash log contains information about the process that crashed, as illustrated in Listing 3. Listing 3: Process information Process: TextEdit [8752] Path: /Applications/TextEdit.app/Contents/MacOS/TextEdit Identifier: com.apple.TextEdit Version: 1.5 (244) Build Info: TextEdit-2440000~2 Code Type: X86 (Native) Parent Process: launchd [241]
The most important thing to note here is the name of the process that crashed. In some cases the actual process that died is not what you think. For example, if your application uses a helper tool to do some work, and that helper tool dies, you want to focus The "Process" field includes the name and PID (in square brackets) of the crashed process. The "Path" field is the path to the process's executable. The "Identifier" field contains the bundle identifier, if any, of the crashed process.
CrashReporter gets the "Version" field from the process's executable. If the process is a packaged application, the version is composed of the
The "Build Info" field shows information extracted from the The "Code Type" field shows the type of code that was executing. If your program is a universal binary, you should check this field to see which architecture was actually being run (for example, the user might have accidentally run your program using Rosetta). The "Parent Process" field includes the name and the PID (in square brackets) of the parent process. It's worth checking that this is what you'd expect it to be. Note: In crash logs prior to version 6 the "Process" field was known as the "Command" field, and the process ID was included in a separate "PID" field. Note: The "Path" and "Version" fields were introduced with version 2 crash logs. Note: The "Identifier" field was introduced with version 6 crash logs. Note: In crash logs prior to version 6 the information in the "Build Info" field was split across three separate fields: "Build Version", "Project Name" and "Source Version". These fields were introduced with version 3 crash logs. Note: The "Code Type" field was introduced with version 6 crash logs. Note: In crash logs prior to version 6 the "Parent Process" field was named "Parent". It was first included in version 3 crash logs. Note: In crash logs prior to version 6 the process information part of the crash log was placed after the basic information part. Basic InformationThe next part of the crash log contains information about the crash log itself. You can see an example in Listing 4. Listing 4: Basic information Date/Time: 2008-01-29 12:32:46.239 +0000 OS Version: Mac OS X 10.5.1 (9B18) Report Version: 6
The most important piece of information here is the OS version. You should pay particular attention to the build number; each user-visible version of Mac OS X can have multiple variants distinguished only by their build numbers (this typically happens for hardware-specific The "Report Version" field is discussed in Crash Log Versions. Note: Version 2 crash logs included a "Host Name" field in this section; this is not present in later versions. Exception Information
The third part of the crash log shows information about the processor exception that was the immediate cause of the crash. Listing 5 shows Listing 5: Exception information Exception Type: EXC_BAD_ACCESS (SIGBUS) Exception Codes: KERN_PROTECTION_FAILURE at 0x0000000000000000 Crashed Thread: 0
The "Crashed Thread" field denotes the thread that crashed; it is redundant because the backtrace section highlights the crashing Note: The "Crashed Thread" field was introduced in version 2 crash logs. Prior to version 6 crash logs it was called "Thread" and it appeared in the process information section. The most common forms of exception are:
For memory access exceptions ( Backtrace Information
The fourth part of the crash log, which displays a backtrace for all of the threads in the crashed process, is typically the most interesting. Listing Listing 6: Backtrace information Thread 0 Crashed: 0 ??? 0000000000 0 + 0 1 com.apple.CoreFoundation 0x942cf0fe CFRunLoopRunSpecific + 18… 2 com.apple.CoreFoundation 0x942cfd38 CFRunLoopRunInMode + 88 3 com.apple.HIToolbox 0x919e58a4 RunCurrentEventLoopInMode… 4 com.apple.HIToolbox 0x919e56bd ReceiveNextEventCommon + … 5 com.apple.HIToolbox 0x919e5531 BlockUntilNextEventMatchi… 6 com.apple.AppKit 0x9390bd5b _DPSNextEvent + 657 7 com.apple.AppKit 0x9390b6a0 -[NSApplication nextEvent… 8 com.apple.AppKit 0x939046d1 -[NSApplication run] + 79… 9 com.apple.AppKit 0x938d19ba NSApplicationMain + 574 10 com.apple.TextEdit 0x00001df6 0x1000 + 3574
In this example there is only one thread, so there's only one backtrace. In a multi-threaded process, there is one backtrace per thread. Thus, it's critical that you identify the thread that crashed. CrashReporter makes this easy by tagging that backtrace with Note: Your process may be multi-threaded even if you don't explicitly create any threads. Various frameworks can create threads on your behalf. For example, CFSocket creates a thread to integrate sockets with the runloop.
Each line of the backtrace describes a nested function invocation (a frame), with the most recently executed function at the top and the least recently executed at the bottom. For each frame, the columns in the backtrace are as
Finally, if your program is multi-threaded, you can often identify which thread is which by looking at the symbolic names deep within the backtrace. For example, in Listing Thread State
The next part of the crash log contains a dump of the processor state of the thread that crashed. Listing 7 shows an example of Listing 7: PowerPC thread state Thread 0 crashed with PPC Thread State 64:
srr0: 0x0000000000000000 srr1: 0x000000004000d030 …
cr: 0x44022282 … lr: 0x000000009000a6bc…
r0: 0x00000000ffffffe1 r1: 0x00000000bfffeb10 r2: 0x00000000a…
r4: 0x0000000003000006 r5: 0x0000000000000000 r6: 0x000000000…
r8: 0x0000000000000000 r9: 0x0000000000000000 r10: 0x000000000…
r12: 0x000000009000a770 r13: 0x0000000000000000 r14: 0x000000000…
r16: 0x0000000000000000 r17: 0x0000000000000000 r18: 0x000000000…
r20: 0x00000000101a7026 r21: 0x00000000be5b19d8 r22: 0x000000000…
r24: 0x0000000000000450 r25: 0x0000000000001203 r26: 0x000000000…
r28: 0x0000000000000000 r29: 0x0000000003000006 r30: 0x000000000…
To get the most out of this information, you need a good understanding of the Mac OS X application binary interface (ABI) for the processor. For a detailed description, see Mac PowerPC ArchitectureFor PowerPC-based computers, you should consider the following points:
| ||||||||||||||||||||||