As we explained in Series#6 The kernel crash dump file generation process
, there are some conditons that no crash dump will be generated.
(1) Crash occurred before paging file was open
As we mentioned above, paging file is opened by the first user-mode
process smss.exe. But during the boot process, a lot of boot/system
drivers will be loaded and initialized before smss.exe, any one of them
might cause boot failure, then smss.exe will not run, then the paging
file will not be opened, then no crash dump.
(2) Spontaneous reboot due to hardware failure without entering the
crash dump code.
(3) Hung system
(4) Paging file too small to hold dumps
(5) Not enough free disk space to extract dump
For (4) and (5) we can simply increase the paging file and disk size to solve this issue. For other scenarios, we can use remote debugging method.
1. Configuring Hardware Connection
Remote debugging requires two machines, one of them (host
) monitors another (target
). For the virtual machine software, such as VMWare workstation, only one physical machine is required, the host can monitor the guest OS running within host machine. In today's session, we only talk about the rebot debugging with two physical machines. And we will talk about how to debug with vmware next session.
Since remote debugging requires two machines, we need to find a way to connect the two machines.
Choosing Kernel Debugging Settings
- Host computer and target computer connected through the COM ports with Null-Modem Cable Connection.
- Host computer and target computer connected by a 1394 cable. This is
supported only if both the host and the target are running Windows XP or later.
- Host computer and target computer connected by a USB 2.0 debug
cable. The target computer must be running Windows Vista or a later version of Windows, and the host computer must be running Windows 2000 or a later version.
For 1394 cable and debug cable connections, there are some additional configuration required and some limits, for details please refer to the help of windbg. This session, we only take COM ports connection as example.
2. Enable debugging in boot options on target machine.
2.1 Boot options in Boot.ini (XP-)
Open boot.ini which is a hidden file under your system root, add below bolded line.
[boot loader]
timeout=30
default=multi(0)disk(0)rdisk(0)partition(1)/WINDOWS
[operating systems]
multi(0)disk(0)rdisk(0)partition(1)/WINDOWS="Debugging with Cable" /fastdetect /debug /debugport=COM1 /baudrate=57600
multi(0)disk(0)rdisk(0)partition(1)/WINDOWS="Microsoft Windows XP Professional" /fastdetect
/debug switch enabled debugging. /debugport defines a COM port on the computer, /baudrate defines the data transfer rate between host and target. Make sure the host machine have the same baud rate.
2.2 Boot Options in Windows Vista+
To make it more security, starting Vista and later windows, there is no boot.ini any more, instead, the Boot Configuration Data (BCD) store contains boot configuration parameters.
We will need to use command line and the bcdedit
command to change the boot options.
Below are the commands to add a new boot debug entry into BCD. Please run them with administrator priviledge.
(1)bcdedit /copy {current} /d "DebugEntry"
The entry was successfully copied to {ffb75284-7c91-11de-9194-b0e742dc27b6
}.
This command will copy the current boot entry to a new one named "DebugEntry", and grant it a new GUID.
(2)bcdedit /debug {ffb75284-7c91-11de-9194-b0e742dc27b6
} on
(3)bcdedit
Just run "bcdedit", it will list all the boot option entries. something like below, you can find our newly added debug entry.
Windows Boot Manager
--------------------
identifier {bootmgr}
device partition=C:
description Windows Boot Manager
locale en-US
inherit {globalsettings}
default {current}
resumeobject {ffb75280-7c91-11de-9194-b0e742dc27b6}
displayorder {current}
{ffb75284-7c91-11de-9194-b0e742dc27b6}
toolsdisplayorder {memdiag}
timeout 30
Windows Boot Loader
-------------------
identifier {current}
device partition=C:
path /Windows/system32/winload.exe
description Windows 7
locale en-US
inherit {bootloadersettings}
recoverysequence {ffb75282-7c91-11de-9194-b0e742dc27b6}
recoveryenabled Yes
osdevice partition=C:
systemroot /Windows
resumeobject {ffb75280-7c91-11de-9194-b0e742dc27b6}
nx OptIn
Windows Boot Loader
-------------------
identifier {ffb75284-7c91-11de-9194-b0e742dc27b6}
device partition=C:
path /Windows/system32/winload.exe
description DebugEntry
locale en-US
inherit {bootloadersettings}
recoverysequence {ffb75282-7c91-11de-9194-b0e742dc27b6}
recoveryenabled Yes
osdevice partition=C:
systemroot /Windows
resumeobject {ffb75280-7c91-11de-9194-b0e742dc27b6}
nx OptIn
debug Yes
(4)bcdedit /dbgsettings
debugtype Serial
debugport 1
baudrate 115200
By default the debug will use COM1 as communication channel, you can use BCDEdit /dbgsettings to change the global settings.
For example:
(5)bcdedit /dbgsettings serial debugport:2 baudrate:115200
Finally, we can start the remote debugging.
3. Remote Debugging with windbg (dual physical machine)
(1)Change target machine’s boot options
(2)Connect target machine with null-modem cable
(3)Install WinDBG in host machine
(4)Start WinDBG, select File->Kernel Debug
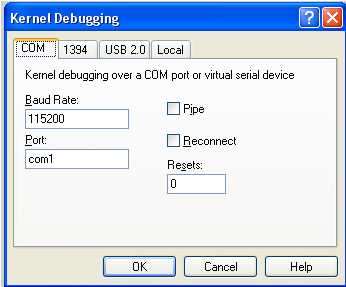
(5) Reboot the target machine.
(6) Wait for windbg to attach the target machine, once you have "broken in" to the debuggee, the entire target machine
will be stopped - not even the mouse will be active.
At this point you can just hit F5 in WinDbg to let the hosted OS
continue booting.
(7)Then trigger your problem to happen, such as system hangs, boot failures. At this point, on the host machine, select windbg's Debug -> Break, which will stop the target machine. Then type below command in windbg to collect crash dumps.
>.crash /ma c:/os.dmp
.
Now, you can wait, wait, and wait.... As windbg said, it is a VERY VERY slow operation to collect full kernel
dump over COM port.

Collecting crash dumps through COM ports has one shortcoming, it will cost much time to collect dumps due to the slow baud rate (~10KB/s). One simple way is to reduce your RAM by unplugging some of your RAM chips or
add /maxmem=xxx
parameter
into boot.ini for xp-, or for vista+ use bcdedit /set
command, change below GUID to your own,
bcdedit /set {18b123cd-2bf6-11db-bfae-00e018e2b8db
} removememory 1536
Please refer to http://msdn.microsoft.com/en-us/library/ff542290%28VS.85%29.aspx
for details.
This is it!
See you next session which will talk about how to use VMWare to debug remotely.
-Eric