http://support.sas.com/resources/papers/proceedings12/163-2012.pdf
文章比较了较传统的股票分析方法:移动平均MA,相对强度指标RSI,布连线;处于数据的连续和完整,文章选取1981.1.2-2010.12.31时间内纽交所都进行交易的股票数据,共计355只个股。数据包含了一下变量:日期date,股票的ID,日收益RET,股票调整价格ADJPRC,格式如下如:
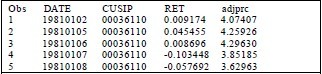
355只股票的平均日收益0.0638%,标准差sd=2.2624%.如果预测收益超过阀值就意味着该方法有效。
1.移动平均方法
1日/2日/5日移动平均线为短期均线,50日/150日/200日为长期均线。当短期均线从下向上穿越长期均线,作为买入信号;反之为卖出信号。假设投资者持有或卖出股票严格遵守交易信号进行操作,这种策略为“变长移动平均-VMA”;如果投资者按照固定天数持有或卖出股票,这种策略称为“定长移动平均-FMA”。
data MA;
   set summer.sample;
   MA2 = adjprc;
   MA5 = adjprc;
   MA50 = adjprc;
   MA150 = adjprc;
   MA200 = adjprc;
run;
proc sort data = MA;
   by cusip date;
run;
%macro calave(days);
   %do i = 1 %to &days-1;
       data MA;
          set MA;
          MA&days = MA&days + lag&i(adjprc);
          if &i = &days-1 then MA&days = MA&days/&days;
          if &i = &days-1 then do;
             if &days = 2 and date<mdy(01,05,81) then MA2 = .;
             if &days = 5 and date<mdy(01,08,81) then MA5 = .;
             if &days = 50 and date<mdy(03,13,81) then MA50 = .;
             if &days = 150 and date<mdy(08,05,81) then MA150 = .;
             if &days = 200 and date<mdy(10,15,81) then MA200 = .;
          end;
       run;
   %end;
%mend;
%calave(2)
%calave(5)
%calave(50)
%calave(150)
%calave(200)
data summer.MovingAverage;
   set MA;
run;
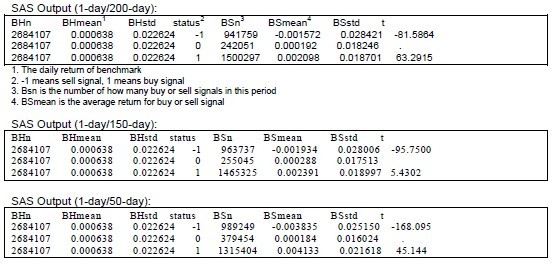
下面的代码测试VMA ,该例测试了1日/200日,1日/150日,1日/50日的短线长线策略。
data MAresult;
   set summer.movingaverage;
run;

proc means data = MAresult noprint;
   var ret;
   output out = buyandhold n = BHn mean = BHmean std = BHstd;
run;

data MAresult;
   set MAresult;
   if adjprc=. or MA200=. then status = 0;
   else if adjprc>MA200*1.01 then status = 1; *VMA buy(1,200,0.01);
   else if adjprc<MA200*0.99 then status = -1; *VMA sell(1,200,0.01);
   else status = 0;

   if adjprc=. or MA50=. then status = 0;
   else if adjprc>MA50*1.01 then status = 1; *VMA buy(1,50,0.01);
   else if adjprc<MA50*0.99 then status = -1; *VMA sell(1,50,0.01);
   else status = 0;

   if adjprc=. or MA150=. then status = 0;
   else if adjprc>MA150*1.01 then status = 1; *VMA buy(1,150,0.01);
   else if adjprc<MA150*0.99 then status = -1; *VMA sell(1,150,0.01);
   else status = 0;
run;

proc sort data = MAresult;
   by status;
run;
proc means data = MAresult noprint;
   var ret;
   by status;
   output out = buyandsell n = BSn mean = BSmean std = BSstd;
run;
data VMAfinal; *VMA final result!;
   merge buyandhold buyandsell;
   by _TYPE_;
   drop _FREQ_ _TYPE_;
   if status ~= 0 then
            t =(BSmean-BHmean)/sqrt(BHstd*BHstd/BHn+BHstd*BHstd/BSn);
run;
测试结果如下:
2.相对强弱指标策略:Relative Strength Index
RSI的原理简单来说是以数字计算的方法求出买卖双方的力量对比,譬如有100个人面对一件商品,如果50个人以上要买,竞相抬价,商品价格必涨。相反,如果50个人以上争着卖出,价格自然下跌。强弱指标理论认为,任何市价的大涨或大跌,均在0-100之间变动,根据常态分配,认为RSI值多在30-70之间变动,通常80甚至90时被认为市场已到达超买状态,至此市场价格自然会回落调整。当价格低跌至30以下即被认为是超卖状态,市价将出现反弹回升。具体的公式:
• RS = Ave. Gain / Ave. Loss in prior n days;
• RSI = 100 – 100 / (1+RS)
文章计算了14日RSI,下面的代码系在SAS中定义RSI:
*define RSI in SAS
RS = Ave. Gain / Ave. Loss in prior n days
RSI = 100 – 100 / (1+RS);
data RSI;
   set RSI;
   by cusip;
   ladjprc = lag(adjprc);
   if adjprc>ladjprc then gain = adjprc-ladjprc;
   if adjprc<ladjprc then loss = ladjprc-adjprc;
   if first.cusip then do;
      gain = .;
      loss = .;
   end;

   retain days 0;
   days+1;
   if first.cusip then days = 1;
   if gain = . then gain = 0;
   if loss = . then loss = 0;

   retain sumgain 0;
   sumgain = sumgain + gain;
   retain sumloss 0;
   sumloss = sumloss + loss;
   if days=15 then do;
      AveGain = (sumgain-gain) / 14;
      AveLoss = (sumloss-loss) / 14;
      RS = AveGain / AveLoss;
      RSI = 100-100/(1+RS);
   end;
   drop sumgain sumloss;
run;

%macro calRSI();
   %do i=16 %to 7570;
       data RSI;
          set RSI;
          lAveGain = lag1(AveGain);
          lAveLoss = lag1(AveLoss);
          if days = &i then do;
             AveGain = (lAveGain*13+gain)/14;
             AveLoss = (lAveLoss*13+loss)/14;
             RS = AveGain / AveLoss;
             RSI = 100-100/(1+RS);
          end;
   %end;
%mend;
%calRSI;
data summer.RSIresult;
   set RSI;
run;
下面的代码测试了“变长RSI”(Variable-Length RSI,VRSI),定义超买信号为RSI>80,RSI<60时投资者弱卖;RSI<20为超卖信号,RSI>40强卖信号。
data VRSIB;
   set RSIresult;
   by cusip;
   drop status;
   retain period 0;
   if first.cusip then period = 0;
   if RSI<20 then period = 1; *RSI<20 buy and until RIS>40;
   if RSI>40 then period = 0;
      RealPeriod = lag(period);
   if RealPeriod = 0 then delete;
run;

data VRSIS;
   set RSIresult;
   by cusip;
   drop status;
   retain period 0;
   if first.cusip then period = 0;
   if RSI>80 then period = 1; *RSI>80 sell and until RIS<60;
   if RSI<60 then period = 0;
      RealPeriod = lag(period);
   if RealPeriod = 0 then delete;
run;
proc means data = VRSIB;
   var ret;
run;
proc means data = VRSIS;
   var ret;
run;
结果如下:
3.布连线策略BOLLINGER BANDS STRATEGY (BOLL)
BOLL指标的计算公式 :
中轨线=N日的移动平均线
上轨线=中轨线+两倍的标准差
下轨线=中轨线-两倍的标准差
BOLL指标的计算过程
(1)计算MA : MA=N日内的收盘价之和÷N
(2)计算标准差MD:MD=平方根N日的(C-MA)的两次方之和除以N
(3)计算MB、UP、DN线 :MB=(N-1)日的MA,UP=MB+2×MD,DN=MB-2×MD
文章,以20日作为移动平均日期,2(4)倍标准差作为上下轨与中轨距离。股价在大于上轨为卖出信号,股价低于下轨为买入信号。作者下面的代码测试了“变长的布林线策略”。
/*The following program illustrates how we define the Bollinger Bands Strategy in SAS*/ data BB; set summer.sample; MA20 = 0; run;
proc sort data = BB; by cusip date; run;
%macro calave(days); %do i = 1 %to &days; data BB; set BB; MA&days = MA&days + lag&i(adjprc); if &i = &days then MA&days = MA&days/&days; if &i = &days then do; if &days = 20 and date<mdy(02,05,81) then MA20 = .; end; run; %end; %mend; %calave(20)
%macro sd; proc delete data=all; run;
%do firstobs = 1 %to (2684248-20); %let lastobs = %eval( &firstobs + 19); proc means data=BB(firstobs=&firstobs obs=&lastobs) noprint; var adjprc; output out=tempfile stddev=sd20; run; proc append base=all data=tempfile; run; %end; %mend sd; %sd;
data summer.BBand; set all; run;
下面的代码测试了布林线策略:
/*The following program evaluates the variable and fixed Bollinger Bands: Program 3B:*/
data BB;
   set summer.finalBB;
       upperband = MA20+2*sd20;
       lowerband = MA20-2*sd20;
       upperband1 = MA20+1*sd20;
       lowerband1 = MA20-1*sd20;
       if adjprc>upperband then status = -1;
       else if adjprc<lowerband then status = 1;
       else status = 0;
run;
data VBBB;
   set BB;
   by cusip;
   drop status;
   retain period 0;
   if first.cusip then period = 0;
   if adjprc<lowerband then period = 1;
   if adjprc>lowerband1 then period = 0;
      RealPeriod = lag(period);
   if RealPeriod = 0 or RealPeriod = . then delete;
run;
data VBBS;
   set BB;
   by cusip;
   drop status;
   retain period 0;
   if first.cusip then period = 0;
   if adjprc>upperband then period = 1;
   if adjprc<upperband1 then period = 0;
      RealPeriod = lag(period);
   if RealPeriod = 0 or RealPeriod = . then delete;
run;
proc means data=VBBB;
   var ret;
run;
proc means data=VBBS;
   var ret;
run;
测试结果如下:
