http://www4.stat.ncsu.edu/~reich/st740/MSEplots.R
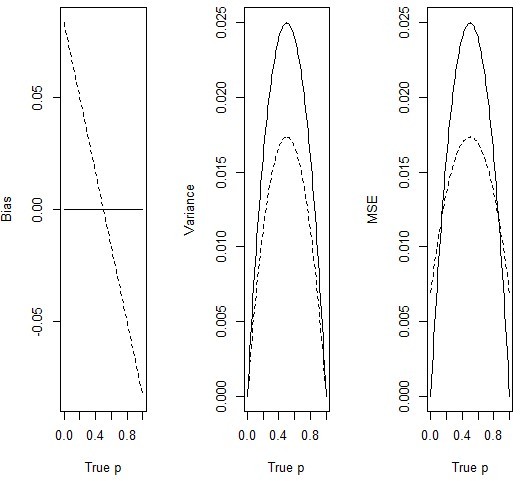
MSEplot<-function(n,a,b,plot.type="mse"){
   #This function assumes the model y~binom(n,p); p ~ beta(a,b)
   #and compares the bias, variances, and MSE of
   #d1=y/n (MLE) and d2=(y+a)/(n+a+b)

   p.grid<-seq(0,1,0.01)

   bias1<-0*p.grid
   bias2<-(a-(a+b)*p.grid)/(n+a+b)

   var1<-p.grid*(1-p.grid)/n
   var2<-n*p.grid*(1-p.grid)/(n+a+b)^2

   mse1<-bias1^2+var1
   mse2<-bias2^2+var2

   if(plot.type=="bias"){
       plot(p.grid,bias1,type="l",xlab="True p",ylab="Bias",ylim=range(c(bias1,bias2)))
       lines(p.grid,bias2,lty=2)
   }

   if(plot.type=="variance"){
       plot(p.grid,var1,type="l",xlab="True p",ylab="Variance",ylim=range(c(var1,var2)))
       lines(p.grid,var2,lty=2)
   }

   if(plot.type=="MSE"){
       plot(p.grid,mse1,type="l",xlab="True p",ylab="MSE",ylim=range(c(mse1,mse2)))
       lines(p.grid,mse2,lty=2)
   }
#   legend("topright",c("MLE","Post Mean"),lty=1:2,inset=0.05)
}

par(mfrow=c(1,3))
MSEplot(n=10,a=1,b=1,plot.type="bias")
MSEplot(n=10,a=1,b=1,plot.type="variance")
MSEplot(n=10,a=1,b=1,plot.type="MSE")