SAS® Fundamentals For Survey Data Processing
Renato G. Villacorte, Fairbank, Maslin, Maullin & Associates, Santa Monica, California
ABSTRACT
This paper offers several programming solutions to problems and challenges that commonly confront survey
researchers. Arrays and Do Loops are presented as methods for handling data cleaning and transforming. Proc
FREQ, TABULATE, and MEANS are demonstrated for elementary analyses. Lastly, formatting techniques are used
to improve analyses and enhance the clarity of output. A small number of advanced techniques are also
demonstrated for more experienced programmers.
INTRODUCTION
Conducting surveys is the easiest and most accessible method of studying a population. However, as simple as it is
to create a questionnaire and gather data, the processing and analyzing of the data often stumbles amateurs. This
paper is meant as a tutorial for the amateur or casual analyst and a primer for the entry level professional. First, we
will discuss data inspection and what one can expect when given a dataset of survey data. We will present efficient
methods of transforming variables within the data step using loops and arrays. As we proceed, we will demonstrate a few elementary procedures for generating descriptive statistics. Lastly, we will introduce formatting methods and
ways to improve procedure reports. While we will discuss a little bit about survey design, we will concentrate only on
how the design affects the data processing.
INITIAL DATA INSPECTION
As professional analysts, one of our cardinal principles when it comes to data entry is to let someone else do it.
However, this means that it is up to you to thoroughly inspect the data for proper coding and formatting. When
dealing with larger datasets with components that may have been entered by different people, you must also look for standardization and continuity.
METHODS OF DATA INSPECTION
There are two primary methods of initially inspecting data. The first method is to view the dataset and scroll through
the variable columns and record rows. While this will only detect the grossest of errors, it gives you an initial
impression of what kinds of values you will be dealing with and what formats you should expect when running reports.The second method is to run a quick tabulation on each variable of the dataset and closely examine the results. To run a tabulation on each variable in a dataset, you could submit the following code:
As implied, the _ALL_ keyword stands in place of every variable in the dataset. With this output, you can learn a
great deal about your dataset and a close look will reveal problems and issues.
POSSIBLE DATA ISSUES AND PROBLEMS
Unlike publicity, there is such a thing as bad data. The two biggest issues to look for are missing values and nonuniform data entry. Non-uniform data entry occurs when the data entry person changes the value or format of the response codes they are entering. For example, they may have started by entering “1” for male and “2” for female and eventually started entering “M” and “F”, respectively. This is most likely to occur when there are multiple data entry persons and each elected to enter different codes. Clearly, this issue is resolved through transformation codes within the data step.
Missing values is another problem that requires a bit more attention. Data can be missing for several different
reasons. A survey question may not have had “other” as a possible response code and the entry person simply left
the record blank. Another possibility is that the record is blank due to design. If some questions were only meant for
men, all the values for women would be missing for that question. Another possibility is that the respondent simply
didn’t answer the question for one reason or another. This is a problem that rises beyond simple data processing. At
this point, the processor should code whatever is necessary to assist survey researcher in studying these missing
cases.
TRANSFORMING SURVEY DATA WITH ARRAYS AND DO-LOOPS
Data cleaning and transformation is almost always needed after your initial inspections. While processing one
variable is easy enough, survey data usually requires attention to several variables that are similar in type. When a
survey asks a battery of similar questions, the topic of the question may change but the response codes are identical.For instance, a survey may ask to rate their favorability of a candidate on a scale of 1 through 5. The battery will consist of a number of different candidates rated on the same scale. In this case, missing values and code
transformations will apply similarly to each item in the battery. The following examples show how you can take
advantage of arrays and do-loop processing when transforming several similar items.
EXAMPLE OF EXPLICIT RECODING
The simplest and least sophisticated method of transforming data is to process each variable individually. Our
example processes a battery of questions (Q4) with items A through H, which consist of ratings between 1 and 5.
After inspection, we observed several missing values within each item and intend to include them in the analyses.
This clear example of explicit coding transforms the missing values into a code 6.
Clearly, this is effective and somewhat tidy for a battery of eight items. However, for larger surveys, you may have a
battery of 20-40 items and this method would quickly become bulky code.
ARRAY AND DO-LOOP WITH SPECIFIED DIMENSIONS
The exact same process in the previous example can be performed within more compacted code. This code takes
advantage of the fact that each variable is treated in the exact same way. Note that this method transforms the
missing values to a code 7.
The ARRAY keyword is followed by the name of the array (Q4Process), the dimension of the array (8 addresses), and
the name of each variable represented in each address. The do-loop starts with a DO keyword and ends with an
END keyword. The counter (X) will step through the values 1 through 8 each time a loop is executed. On the first
loop, X will equal 1 and the logic will read IF Q4Process(1) = . then Q4Process(1)=7. Q4Process(1) refers to the first
address in the Q4Process array which corresponds to Q4a. The loop will continue to execute the code between the
DO and END keywords until X=8 at the end of the loop. This results in performing the transformation on all 8
addresses in the array which corresponds to Q4a through Q4h.
ARRAY AND DO-LOOPS WITH DATA DRIVEN PROGRAMMING
Up until now, we have specifically defined the parameters for executing these transformations. Data driven
programming describes the concept of obtaining certain parameters from the dataset itself. A simple expression of
this concept is the use of wildcards when defining certain parameters in a procedure. The following example
performs the exact same process as the previous two examples but does it with more flexible code. Note that this
method transforms the missing values to a code 8.
The asterisk in the array dimension parameter indicates that the array is to be whatever size that will accommodate
the number of variables in the assignment portion of the ARRAY statement. We know that there are items Q4a-Q4h
and that will result in an array with 8 addresses. The colon following the Q4 is another wildcard. When compiled,
SAS will translate this into every variable that starts with Q4 and ends in any other character. In our sample dataset,
there is only Q4a-Q4h, so these will be listed individually and assigned to their corresponding address in the array. It
is important to note that this is where you must have great awareness of your dataset and its attributes. The use of
this colon will also include Q4x, Q4alternate, Q41, Q42 Q43, etc. if they also exist in your dataset. Lastly, the DIM
function returns the dimension size of the array within the parentheses. Since our example, Q4Process, has 8
addresses, the function will return and SAS will interpret an 8 in this place. This code is the most efficient example of
this procedure and looks the same whether the Q4 battery has 8 items or 80.
MORE EXAMPLES OF TRANSFORMATION PROCEDURES
There could be several other reasons for needing to transform survey data. One reason is that you may find it
necessary to reverse the values of a variable. For instance, on a particular scale most of the questions may increase
in favorability as it moves from 1 through 5. However, you may have a few items in which this scale needs to be
reversed for the purpose of your analyses. A 1 needs to become a 5 and a 5 needs to become a 1. For instance,
you may want to create an index for people who favor your candidate and simultaneously oppose your opponent. In
this case, you would keep your candidates maximum score at 5 while transforming the opponents score so that their 1 becomes a 5. When you combine the two scores, you will find that those who score a 10 will have given your
candidate a five and your opponent an original 1. The following is a typical first attempt at this procedure.
The problem with this code is that it will fail to transform the variable as intended. The actual result of this procedure
is the transformation of all 5’s and 4’s into 1’s and 2’s, respectively. If you follow along, the 1’s will change into 5’s but then the procedure will continue to step through the other logic. This means that the newly transformed 5 will turn into a 1 again when it hits the last line. This is the result of the data step processing each line of code sequentially and the value of the variable may change, and in this case change back again, as it progresses through the procedure. Note that this is an example of what not to do.
TRANSFORMATIONS WITH SELECT-WHEN
To avoid the sequential processing, you will need code that terminates when the condition is met. That is to say,
once it sees a 5, it will change it a 1 and then discontinue looking for other conditions. You could do this with an
exhaustive set of IF-THEN-ELSE statements, but you can run also you a set of SELECT/WHEN statements. The
following code reverses Q4a’s values according to our specifications.
The first statement initiates a SELECT sequence and indicates that it will be examining Q4a. The following WHEN
statements describe conditions of Q4a and the code to execute if the condition is met. The OTHERWISE statement
is blank here but could also include code to execute if none of the above conditions are met. The difference between
this and the previous example is in the timing of writing to the primary data vector. In this case, it writes to the primary data vector only after reaching the END statement. By this point, the correct instruction has been selected, executed, and now written to the vector.
SELECT-WHEN IN WITH ARRAYS AND A DO-LOOP
Once again, you may encounter the need to do this reversal on several items. The best way to perform this is
integrate the process into an array and do-loop procedure. Here is code that processes missing values and reverses
the value of Q4a.
Note that we did a little more than simply embed the SELECT-WHEN block into the loop. Instead of referring to Q4a
by name, we referred to it as an address within the Q4Process array. We know that Q4a is in address 1 of the array,
so we embed the SELECT-WHEN block within a IF-THEN-DO block and execute it only when X equals 1. The
advantage of this technique is that now you can easily perform the reversal on any number of items with the Q4
battery. If we wanted to perform the reversal on Q4a, Q4d and Q4h, we would simply modify the condition of the
block to:
IF X IN (1,4,8) THEN DO;
Where 1, 4, and 8 correspond to the addresses of Q4a, Q4d, and Q4h.
TRANSFORMING WITH TEMPORARY ARRAYS
Our last example is an ultra-slick way of doing reversals without a SELECT-WHEN block or a complicated IF-THENELSE
block. The following recodes the missing values and performs the reversal on items Q4a and Q4d.
As you can see, we compacted our code to eight readable lines as compared to the previous example’s sixteen. In
this example, we create an array named Reverser with 6 addresses. In address 1, Reverser’s value is 5, 2 is 4, 3 is
3, 4 is 2, etc. Now, we can reassign the value of Q4a by using it’s original value as an address and Reverser’s value
as the newly transformed value. So, if Q4a is originally 1, then Reverser(Q4a) is equal to 5. Notice that now the
missing value code, 6 in this case, is important. It must be a valid address within Reverser. In this example, the
value of Reverser(6) is also 6. If we chose the missing value to be 9, 99, or 999, we would receive an error since
there is no such address for Reverser.
ELEMENTARY STATISTICAL REPORTS
Another reason why surveys are so commonly used is that the results are easily generated and interpreted with
elementary statistical reports. However, since the scope of this paper is limited to handling data and creating simple
reports, we will avoid discussion on developing conclusions from these results.
SIMPLE ONE-DIMENSION TABULATION
As exhibited earlier, the simplest method of tabulating results is to run a FREQ procedure and table _ALL_. To make
these results more readable, we should use formats and put more explicit control on which variables to tabulate. The
following code contains a PROC FORMAT that must be executed prior to running any other procedures that call upon
the formats.
Here, we create the AGE, SEX, and RATE formats that we will call upon in the following code.
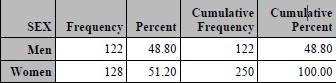
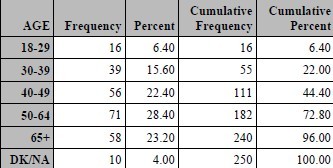
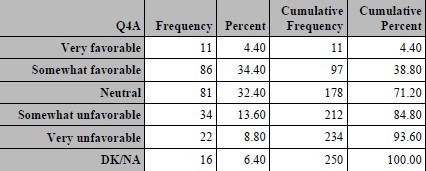
You can see that along with the numeric codes for sex and age, the results for Q4a were presented with labels that
correspond to the possible values of 1 through 5 and code 6 for missing.
TWO-DIMENSION TABULATION
However, the value of asking demographic and classification questions in a survey is so that you can compare the
categories with one another. This is done by creating two dimensional tables that often have the categories in
columns and the question of interest in rows. Another name for this type of report is a contingency table. Using
PROC FREQ, we can create a two-dimension table by adding an asterisk and the categorical variable to the TABLE
statement.

USING PROC TABULATE
PROC FREQ is useful but is limited in features when creating presentation quality tables. The TABULATE procedure
is much more flexible and offers a lot more formatting options.1 The following code produces a finer example of a
one-dimensional tabulation.

In this example, we only wished to present the percentages for each category and display it with a % sign following it.It is important to note that the following code needed to be added to the PROC FORMAT that was presented earlier:
picture pctfmt low-high='009%';
Our second example of TABULATE mimics the two-dimension example for PROC FREQ presented earlier.

Once again, TABULATE produces a cleaner output that is more suitable for presentation reports.
MORE ADVANCED TABULATE
Typically, you are not going to be analyzing one variable at a time when producing contingency tables. Another
feature of TABULATE is the ability to add more classification variables across the table. Here is an example where
we add AGE to the analysis.

REALLY ADVANCED TABULATE
The final ultra-cool feature that we will present for TABULATE is multi-label formatting. Very often, survey analysts
wish to see the results of codes aggregated together. In our example, we would want to see Total Favorable as the
combination of Very and Somewhat Favorable. This can certainly be accomplished by creating two different formats,
but then we would need to see our output run on two different tables. Another method would involve the use of multilabel formatting. The following code creates a new format for the rating scale and then uses the format in a
TABULATE procedure.

Unfortunately, there is a drawback to using this method. As shown, the categories for Q4a are presented in
alphabetical ordered based on the format label. You can cute and paste to get around this bug, but another solution
is to recreate the format with a prefix that will force the desired order of the categories. Here is an example of how to
recreate the format and the resulting table.

CONCLUSION
The procedures presented in this paper have been used over and over again in our business of processing survey
data. We start with inspection and proceed to clean and transform variables as needed in the project. Then, we
create elementary reports and enhance them with formats and other enhancements. These are elementary, but
extremely useful, examples for handling problems commonly confronted on survey projects. As the novice gains
experience with these data handling procedures, they will find them useful for any other type of research data.
REFERENCES
Cody’s Data Cleaning Techniques Using SAS, Ronald P. Cody
Proc Tabulate By Example, Lauren E. Haworth
ACKNOWLEDGMENTS
In addition to my wife and children who support me in all endeavors, there are several people who have helped me
complete this paper. Eliot Roth is the mentor and friend who introduced me to SAS. My colleagues at FMMA inspire
me to improve my programming and development skills. Kimberly LeBouton’s invitations to speak at LABSUG have
led to my deeper involvement in the SAS community. Lastly, I am grateful to Patrick Thornton, Rebecca Otteson, and
Tyler Smith for inviting me to present this paper at WUSS08.
CONTACT INFORMATION
Your comments and questions are valued and encouraged. Contact the author at:
Renato G. Villacorte
Vice-President, Fairbank, Maslin, Maullin & Associates
2425 Colorado Ave, Suite 180, Santa Monica, CA 90404
Work Phone: 310-828-1183
Fax: 310-453-6562
E-mail: renato@fmma.com
Web: www.fmma.com
SAS and all other SAS Institute Inc. product or service names are registered trademarks or trademarks of SAS
Institute Inc. in the USA and other countries. ® indicates USA registration.
Other brand and product names are trademarks of their respective companies.
SAS Global Forum 2009 Foundations and Fundamentals