来篇英文的吧。(部分文字及图片引自《trouble shooting oracle performance,仅供参考)
- Four ways to get execution plan(anytime you want, for specified sql)
• Execute the SQL statement EXPLAIN PLAN, and then query the table where the output was written.
• Query a dynamic performance view showing the execution plans cached in the library cache.
• Query an Automatic Workload Repository or Statspack table, showing the execution plans stored in the repository.
• Activate a tracing facility providing execution plans.
1.1 Explain plan: ( take sql statements as input, generate the sql execution plan into plan_table, use dbms_xplan.display to query the plan_table)

Syntax of the SQL statement EXPLAIN PLAN
Prior to oracle 10g, use utlxplan.sql under path $ORACLE_HOME/rdbms/admin to create the plan_table.
As of Oracle Database 10g, by default, a plan table and a public synonym named plan_table that exposes it to all users are available under the schema SYS.
It is interesting to notice that the default plan table created as of Oracle Database 10g is a global temporary table that stores data up to the end of the session.1 In this way, several concurrent users working with it do not interfere with each other.
How to query the plan_table?
As of Oracle9i Release 2, however, there is an easier and much better way to do it—by using the function display in the package dbms_xplan.
SELECT * FROM table(dbms_xplan.display);
Notes: if bind variable used, the explain plan result is not correct sometimes.
1.2 Dynamic Performance Views( usually for sql statements in SGA)
Four dynamic performance views show information about the cursors present in the library cache:
• v$sql_plan provides basically the same information as the plan table. In other words, it provides execution plans and other related information provided by the query optimizer. The only notable differences between this view and the plan table are due to some columns identifying the cursor related to the execution plan in the library cache.
• v$sql_plan_statistics provides execution statistics, such as the elapsed time and the number of produced rows, for each operation (the row source operation) in the view v$sql_plan. Essentially, it provides the runtime behavior of an execution plan. This is an important piece of information because the view v$sql_plan shows the estimations and decisions taken by the query optimizer only at parse time. Since the collection of execution statistics causes a non-negligible overhead, by default they are not collected. To activate the collection, either the initialization parameter statistics_level must be set to all or the hint gather_plan_statistics must be specified in the SQL statement.
• v$sql_workarea provides information about the memory work areas needed to execute a cursor. It gives runtime memory utilization as well as estimations about the amount of memory needed to efficiently execute operations.
• v$sql_plan_statistics_all shows in a single view all the information provided by the views v$sql_plan, v$sql_plan_statistics, and v$sql_workarea. By using it, you simply avoid manually joining several views.
Notes: The cursors in the library cache (and therefore in these views) are identified by three columns: address, hash_value, and child_number. With the columns address and hash_value, you identify the parent cursors. With all three columns, you identify the child cursors. In addition, as of Oracle Database 10g, it is also possible, and more common as well, to use the column sql_id instead of the columns address and hash_value to identify cursors. The advantage of using the
column sql_id is that its value depends only on the SQL statement itself. In other words, it never changes for a given SQL statement. On the other hand, the column address is a pointer to the handle of the SQL statement in memory and can change over time. To identify a cursor, basically you are confronted with two search methods. Either you know the session executing a SQL statement or you know the text of the SQL statement. In both cases, once the cursor is identified, you can display information about it.
Identifying Child Cursors
- ) For known session:
SELECT status, sql_id, sql_child_number FROM v$session
B ) For sql statements known:
SELECT sql_id, child_number, sql_text
FROM v$sql
WHERE sql_text LIKE '%online discount%' AND sql_text NOT LIKE '%v$sql%';
1.3 Querying Dynamic Performance Views
To obtain the execution plan, you can run queries directly against the dynamic performance views v$sql_plan and v$sql_plan_statistics_all(not recommended, in this case, we need to query the plan from library cache and insert into plan table and query plan table using dbms_xplan.display) . As of Oracle Database 10g, however, there is an easier and much better way to do it—you can use the function display_cursor in the package dbms_xplan.
SELECT * FROM table(dbms_xplan.display_cursor('1hqjydsjbvmwq',0));
AWR: As of Oracle Database 10g, the AWR repository intended to store performance-related information is automatically installed. During normal operation, the database engine is responsible not only for maintaining its content but also for leveraging it for self-tuning purposes. Its purpose is to keep a history of the database workload over the last few weeks.The execution plans stored in AWR are available through the view dba_hist_sql_plan. To query them, the package dbms_xplan provides the function display_awr.
SELECT * FROM table(dbms_xplan.display_awr('1hqjydsjbvmwq'));
Statspack: The predecessor of AWR, called Statspack, is neither automatically installed nor maintained. It is just an add-on that a DBA can install in the database. In any case, its purpose is similar to AWR.
Statspack stores execution plans in the stats$sql_plan repository table when a level equal to or greater than 6 is used for taking the snapshots. Unfortunately, no feature is provided by the package dbms_xplan to query it. I suggest copying the execution plan in a plan table and
displaying it with the function display in the package dbms_xplan.
In addition, for both AWR and Statspack, Oracle provides useful reports for highlighting execution plan changes and resource consumption variation during a period of time for a specific SQL statement. Their names are awrsqrpt.sql and sprepsql.sql, respectively. You will find them under the directory $ORACLE_HOME/rdbms/admin. Note that the script for AWR is available only as of Oracle Database 10g Release 2.
1.4 TracingFacilities
Several tracing facilities provide information about executionplans. Unfortunately, except for SQL trace, all of them are not officially supported.
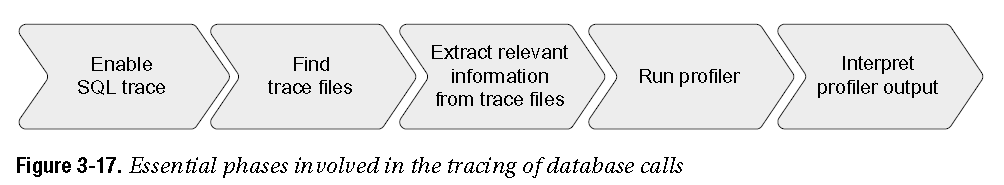
1.4.1 TracingDatabase Calls
SQL trace, it is able to provide detailed trace files containing not only a list of executedSQL statements but also indepth performance figures about their processing.
SQL trace:
The aim of SQL trace is twofold: first, to provide information inorder to break up the responsetime between service time and wait time, and second, to give detailedinformation about the usedresources and synchronization points. All this information regarding each interaction between the SQL engine and theother components is written in a trace file.
Internally,SQL trace is based on debugging event 10046.
Levels of the Debugging Event 10046
Level Description
0 The debugging event is disabled.
1 The debugging event is enabled. For each processed database call,the following information isgiven: SQL statement, response time, service time, number of
processed rows, number of logical reads, number of physical readsand writes, execution plan, andlittle additional information.
4 As in level 1, with additional information about bind variables.Mainly, the data type, itsprecision, and the value used for each execution.
8 As in level 1, plus detailed information about wait time. For eachwait experienced during theprocessing, the following information is given: the name of the
wait event, the duration, and a few additionalparameters identifying the resource that has been waited for.
12 Simultaneously level 4 and level 8.
Notes: DEBUGGING EVENTS
A debugging event, which is identified by anumeric value, is the means used to set a type of flag in a running database engine process. The aim is tochange its behavior, for example, by enabling or disabling a feature, by testing or simulating a corruption orcrash, or by collecting trace or debug information. Some debugging events are not simple flags and can beenabled at several levels. Each level has its own behavior. In some situations, the level is an address of a block ormemory structure.
1.4.1.1 Enabling SQL Trace: The Legacy Way
Up to Oracle9i, the documentation describes three methods for enabling SQL trace: the initializationparameter sql_trace, theprocedure set_sql_trace in the package dbms_session, and the procedure set_sql_trace_in_session in the packagedbms_system. The important thing to notice about these three methods is that all of them are able to enable SQL traceonly at level 1.
To enable and disable SQL trace at any level, there are two mainmethods. Either you set theparameter events by executing the SQL statement ALTER SESSION or you call theprocedure set_ev in the packagedbms_system. While the former can obviously enable SQL trace only for the session that executes it, the latter isable to enable SQL trace in any session by identifying it with a session ID and serial number.
A) The first method to enablesql trace in any level
The following SQL statement enables SQL trace at level 12 for thesession executing it. Noticehow the event number and the level are specified.
ALTER SESSION SET events '10046 trace name contextforever, level 12'
The following SQL statement disables SQL trace for the sessionexecuting it. Notice that thisis not achieved by specifying level 0.
ALTER SESSION SET events '10046 trace name contextoff'
Also we can use alter system set eventsto enable sql trace at instance level.
B)The Second method to enable sql trace in anylevel
The following PL/SQL call enables SQL trace at level 12 for thesession identified by ID 127 andserial number 29. No parameter has a default value. The last parameter then,even if it is not relevant inthis case, must be specified.
dbms_system.set_ev( si=> 127, -- session id
se => 29, -- serial number
ev => 10046, -- event number
le => 12, -- level
nm => NULL)
The following PL/SQL call disables SQL trace for the sessionidentified by ID 127 and serial number 29. Notice that compared to the previous case, only the valueof the parameter specifying thelevel has changed.
dbms_system.set_ev( si=> 127, -- session id
se => 29, -- serial number
ev => 10046, -- event number
le => 0, -- level
nm => NULL)
You can list the session ID and serial number for every userconnected to an instance by executingthe following query:
SELECT sid, serial#, username, machine
FROM v$session
WHERE type != 'BACKGROUND'
1.4.1.2 Enabling SQL Trace: The Contemporary Way
As of Oracle Database 10g, for enabling and disabling SQL trace, thepackage dbms_monitor is provided. Withthis package, not only do you have an official way at last of taking fulladvantage of SQL trace, butmore important, you can enable and disable SQL trace based on the session attributes : client identifier, service name, module name, and action name. This means that if theapplication is correctly instrumented, you can enable and disable SQL trace independently of thesession used to execute the database calls. Nowadays, this is particularly useful because in many situations connectionpooling is used, so users are nottied to a specific session.
Session Level
To enable and disable SQL trace for a session, the package dbms_monitor provides theprocedures session_trace_enable and session_trace_disable,respectively.
The following PL/SQL call enables SQL trace at level 8 for thesession identified by ID 127 andserial number 29. All parameters have default values. If the two parametersidentifying the session are notspecified, SQL trace is enabled for the session executing the PL/SQL call. The parameter waits defaults to TRUE, and theparameter binds defaults to FALSE.
dbms_monitor.session_trace_enable( session_id => 127,
serial_num => 29,
waits => TRUE,
binds => FALSE)
The following PL/SQL call disables SQL trace for the sessionidentified by ID 127 and serial number 29. Be aware that both parameters have default values. Ifthey are not specified, SQL traceis disabled for the session executing the PL/SQL call.
dbms_monitor.session_trace_disable( session_id => 127,
serial_num => 29)
Client Level
To enable and disable SQL trace for a client, the package dbms_monitor provides the procedures client_id_trace_enable and client_id_trace_disable,respectively. Naturally, these procedures can be used only if the session attribute client identifier is set.
dbms_monitor.client_id_trace_enable( client_id=> 'helicon.antognini.ch',
waits => TRUE,
binds => FALSE)
dbms_monitor.client_id_trace_disable(client_id=> 'helicon.antognini.ch')
Component Level
To enable and disable SQL trace for a component specified through aservice name, module name, andaction name, the package dbms_monitor provides the procedures
serv_mod_act_trace_enable and serv_mod_act_trace_disable, respectively. To take full advantage of these procedures, you have to set the session attributes, modulename, and action name.
dbms_monitor.serv_mod_act_trace_enable( service_name=> 'DBM10203.antognini.ch',
module_name => 'mymodule',
action_name => 'myaction',
waits => TRUE,
binds => FALSE,
instance_name => NULL)
dbms_monitor.serv_mod_act_trace_disable( service_name=> 'DBM10203.antognini.ch',
module_name => 'mymodule',
action_name => 'myaction',
instance_name => NULL)
Database Level
As of Oracle Database 10g Release 2, for enabling and disabling SQLtrace for all sessions that connectto a database (except those created by background processes), the package dbms_monitor provides the procedures database_trace_enable and database_trace_disable, respectively.
The following PL/SQL call enables SQL trace at level 12 for adatabase. All parameters have defaultvalues. The parameter waits defaults to TRUE, and the parameter binds defaultsto FALSE. In the case of RealApplication Clusters, by using the parameter instance_name, it is possible to restrict the tracing to a single instance.If the parameter instance_name is set to NULL, which isalso the default value, SQL trace is enabled for allinstances. Again, note that the parameter instance_name is case sensitive.
dbms_monitor.database_trace_enable( waits=> TRUE,
binds => TRUE,
instance_name => NULL)
The following PL/SQL call disables SQL trace for a database. If theparameter instance_name is setto NULL, which is also the default value, SQL trace is disabled for allinstances.
1.4.1.3 Triggering SQL Trace
Timing Information in Trace Files
The dynamic initialization parameter timed_statistics, which can beset to either TRUE or FALSE,controls the availability of timing information such as the elapsed time andCPU time in the trace files. Ifit is set to TRUE, timing information is added to the trace files. If it is setto FALSE, they should bemissing; however, depending on the port you are working on, they could be partially available as well. The defaultvalue oftimed_statistics depends on another initialization parameter: statistics_level.If statistics_level is set to basic, timed_statistics defaults to FALSE. Otherwise, timed_statistics defaults to TRUE.
before enabling SQL trace,make sure that the parameter ( timed_statistics ) is set to TRUE.
Notes: Some initialization parameters are static,and others are dynamic. When they are dynamic, it means they can be changed without bouncing the instance. Among the dynamicinitialization parameters, some of them can be changed only atthe session level, some only at the system level, and others at the session andsystem levels. To change an initializationparameter at the session and system levels, you use the SQL statements ALTER SESSION and ALTER SYSTEM, respectively. Initializationparameters changed at the instance level take effectimmediately or only for sessions created after the modification. The viewv$parameter, or more precisely the columns isses_modifiable andissys_modifiable, provide information about which situation an initialization parameter can be changed in.
If initialization parameters arestatic, we must restart instance to make it take effect.
Limiting the Size of Trace Files
it is possible to set at the session or system level the dynamicinitialization parameter max_dump_file_size tomake maximumtrace file size. ALTER SESSION SET max_dump_file_size = unlimited /[nk|MB]
Finding Trace Files
• Dedicated server processes create trace files in the directoryconfigured through the initializationparameteruser_dump_dest.
• Background processes create trace files in the directoryconfigured through the initialization parameterbackground_dump_dest.
Note that the following are considered background processes:processes listed in v$bgprocess,dispatcher processes (Dnnn), shared server processes (Snnn), parallel slave
processes (Pnnn), job queue processes (Jnnn), advanced queuingprocesses (Qnnn), MMON slaveprocesses (Mnnn), and ASM-related processes (Onnn). The process type isavailable in the column type ofthe view v$session.
As of Oracle Database 11g, with the introduction of the AutomaticDiagnostic Repository, theinitialization parameters user_dump_dest and background_dump_dest aredeprecated in favor of theinitialization parameter diagnostic_dest. Since the new initializationparameter sets the basedirectory only, you can use the view v$diag_info to get the exact location ofthe trace files. The followingqueries show the difference between the value of the initialization parameter and the location of the tracefiles:
SQL> SELECT value FROM v$parameterWHERE name = 'diagnostic_dest';
VALUE
------------------------------------------------------------------
/u00/app/oracle
SQL> SELECT value FROM v$diag_infoWHERE name = 'Diag Trace';
VALUE
------------------------------------------------------------------
/u00/app/oracle/diag/rdbms/dbm11106/DBM11106/trace
Structure of the Trace Files
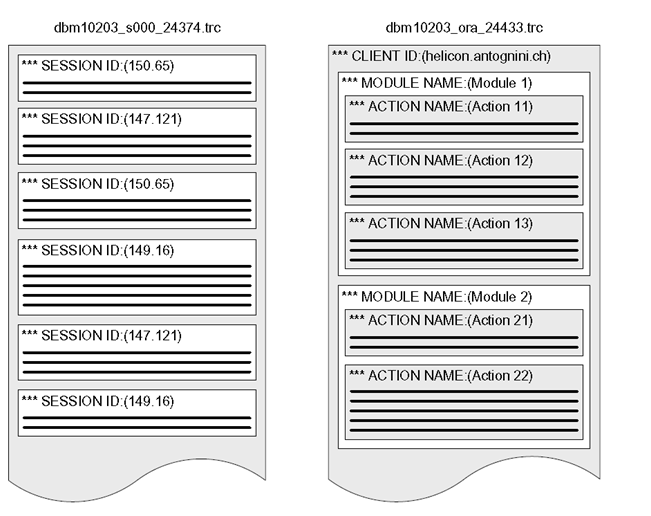
Using TRCSESS
You can use the command-line tool TRCSESS, which is available as ofOracle Database 10g, to extractpart of the information contained in one or more trace files, based on thelogical sections describedearlier. To get a complete list of its arguments, run it without arguments.
trcsess [output=<output file name >][session=<session ID>(session id.serial#)] [clientid=<clientid>]
[service=<service name>] [action=<action name>][module=<module name>]
<trace file names>
trcsessoutput=action12.trc action="Action 12" dbm10203_ora_24433.trc (Notes: Howto identify the 24433 process? Here is the solution :select addr,pid,spid fromv$process where addr in (select paddr as addr from v$session where sid=xxx) );
Rememberthat the arguments clientid, service, action, and module are case sensitive.
Profilers
Once you have identified the correct trace files, or possibly cutoff part of some of them with TRCSESS,it is time to analyze the content. For this purpose, you use a profiler. Itsaim is to generate a formattedoutput based on the content of raw trace files. Oracle distributes with both the database and client binaries sucha profiler. Its name is TKPROF (which stands forTraceKernel PROfiler).
Using TKPROF
TKPROF is a command-line tool. Its main purpose is to take a rawtrace file as input and generatea formatted text file as output. In addition, it is also able to generate a SQLscript to load the data in adatabase, although this feature is hardly ever used.
tkprof DBM11106_ora_6334.trcDBM11106_ora_6334.txt
Usage: tkprof tracefile outputfile [explain= ] [table= ] [print= ] [insert= ] [sys= ] [sort= ][…….]
1.4.2 Event 10053
ALTERSESSION SET events '10053 trace name context forever'
ALTERSESSION SET events '10053 trace name context off'
1.4.3 Event 10132
•Enable and disable the event for the current session.
ALTERSESSION SET events '10132 trace name context forever'
ALTERSESSION SET events '10132 trace name context off'
• Enable and disable the event for the whole database. Warning: thissetting does not take effectimmediately but only for sessions created after the modification.
ALTERSYSTEM SET events '10132 trace name context forever'
ALTERSYSTEM SET events '10132 trace name context off'